Grade Calculator
Generate a complete score chart to see grades for every possible number of mistakes.
| Wrong | Right | Percentage | Grade |
|---|
Grade Calculator: Free Weighted & Final Grade Calculator (2026 Guide)
Trying to figure out exactly where you stand in a class, or what you need on the final to hit a target grade? This grade calculator guide explains exactly how weighted and points-based grading actually work, walks through the formulas behind the numbers, and shows you how to read your own results with confidence.
Everything below maps directly to what the grade calculator on this page computes when you enter your assignments, weights, and target.
What Is AP Computer Science A?
A grade calculator turns a scattered list of assignment scores into one clear number: your current grade in a class, and often the score you still need on what's left to hit a target. It answers the question every student eventually asks — "am I actually passing this?" — without you having to do the arithmetic by hand.
The tricky part isn't addition. It's that most courses don't weigh every assignment equally. A grade calculator handles that weighting automatically, whether your syllabus lists categories as percentages or as raw point totals.
Types of Grading Math
Every grade calculator ultimately runs one of two underlying math models, and knowing which one your class uses is the difference between an accurate result and a misleading one.
| Feature | Point-Based System | Weighted System |
|---|---|---|
| Math logic | Simple ratio (points earned ÷ points possible) | Percentage allocation by category |
| Flexibility | Low — every point counts equally | High — exams can count far more than homework |
| Typical use | K–12, math-heavy courses | University courses, AP classes |
| Transparency | High — easy to verify by hand | Moderate — requires knowing category weights |
Neither system is more "correct" than the other — they're just different rulebooks. The syllabus tells you which one applies, and a grade calculator needs that setting right before its output means anything.
How to Use a Grade Calculator
Getting an accurate result from any grade calculator comes down to matching its settings to your actual syllabus. Here's the process:
- Choose your grade format. Percentage (e.g., "92%") if your syllabus lists scores that way, Points (e.g., "85/100") for a points-based class, or Letter Grade if that's all you were given.
- Select your weighting mode. If the syllabus says "exams are 40% of your grade," use percentage weighting. If the class is just a running total out of a fixed number of points, use points weighting instead.
- Add every graded assignment with its score and its weight or point value. Naming each row is optional, but the weight is required.
- Enter a target grade (optional) if you want the calculator to work backward and tell you what you need on what's left.
- Read the results: your current grade based only on completed work, a check that your weights add up to 100%, and — if you entered a target — whether that goal is still mathematically reachable.
The Final Grade Formula
This is the calculation a grade calculator runs whenever you ask "what do I need on the final?" It works backward from your target grade to solve for the one unknown — your required final exam score.
In plain terms: take your target, subtract the portion of it your existing work has already locked in, then divide the remainder by how much the final controls. Whatever's left is the score you need.
Worked example: you're sitting at 88% and the final is worth 20% of the course grade, but you want to finish with a 90%. Your prior work already contributes 88 × 0.8 = 70.4 points. That leaves 90 − 70.4 = 19.6 points the final has to supply. Divide by its weight: 19.6 ÷ 0.2 = 98% — steep, but not impossible.
Final Exam Calculator
A final exam calculator is really just the Final Grade Formula applied specifically to the last assessment of the term — the one moment where "am I going to get the grade I want" becomes a concrete number instead of a vague hope.
It works the same whether that final assessment is a written exam, a capstone project, a paper, or a presentation. All that matters is its weight in your overall course grade.
| Current Grade | Target Grade | Final Weight | Score Needed on Final |
|---|---|---|---|
| 85% (B) | 90% (A-) | 20% | 110% — not reachable |
| 85% (B) | 90% (A-) | 40% | 97.5% — very difficult |
| 78% (C+) | 80% (B-) | 15% | 91.3% — doable |
| 60% (D-) | 70% (C-) | 25% | 100% — a perfect score |
Notice how much a heavier final changes the picture: at the same 85%-to-90% jump, a 20%-weight final makes the goal mathematically impossible, while a 40%-weight final brings it into (difficult) reach. A grade calculator surfaces this instantly instead of leaving you to do trial-and-error algebra during finals week. If you only need this specific calculation, our standalone Final Grade Calculator is built just for it.
Needed-Score Cheat Sheet
To make the final-grade formula easier to eyeball, here's the score needed to finish a course at 90%, pre-computed across a range of current grades and final-exam weights.
| Current Grade | Final Worth 10% | Final Worth 20% | Final Worth 30% | Final Worth 50% |
|---|---|---|---|---|
| 75% | >100 | >100 | >100 | >100 |
| 80% | >100 | >100 | >100 | 100 |
| 85% | >100 | >100 | >100 | 95 |
| 90% | 90 | 90 | 90 | 90 |
| 95% | 45 | 70 | 78.3 | 85 |
Two patterns stand out. When your current grade already equals your target, the needed score equals the target too, no matter the weight — a 90% student needs a 90% final, period. And when you're below target, a heavier final actually works in your favor: at 85%, a 50%-weight final makes a 90% reachable (you'd need a 95), while a 10%-weight final can't get you there at all.
When You Need More Than 100%
If a grade calculator tells you the score needed is over 100%, the final alone genuinely can't carry you to that target — but that's not necessarily the end of the conversation.
- Extra credit can add points the base formula doesn't know about
- Regrade requests on earlier assignments can raise your current grade, which lowers what the final needs to supply.
- Category quirks — like a syllabus that drops your lowest quiz score — can shift the math in your favor once applied.
If none of those apply to your situation, the realistic move is aiming for the top of the next grade band down rather than chasing a mathematically closed door.
Weighted Grade Calculation
A weighted grade calculator sums the product of each score and its weight, expressed as a decimal or percentage.
Example: Math course graded 80%, weighted 30%. Biology graded 90%, weighted 50%. History graded 72%, weighted 20%.
(30% × 80) + (50% × 90) + (20% × 72) = 24 + 45 + 14.4 = 83.4%
If your weights aren't already expressed as percentages — say, courses weighted by credit hours instead — divide the weighted sum by the total of the weights themselves rather than assuming they already total 100.
Points-Based vs. Weighted Grading
Most grading confusion traces back to one root cause: not knowing which of these two systems your specific class actually uses. Get this setting wrong in a grade calculator and every downstream number will be off, even though the arithmetic itself is correct.
Points-Based (Unweighted) Grading
Every point counts exactly the same, regardless of what assignment it came from. A point earned on homework is worth precisely as much as a point earned on the final exam.
Example: 450 points earned out of 500 possible = 90%.
Weighted (Percentage) Grading
Categories carry different values regardless of how many individual points sit inside them. A professor might set "tests" at 60% of the grade and "homework" at just 10%, meaning a perfect homework score barely moves the needle compared to a strong test score.
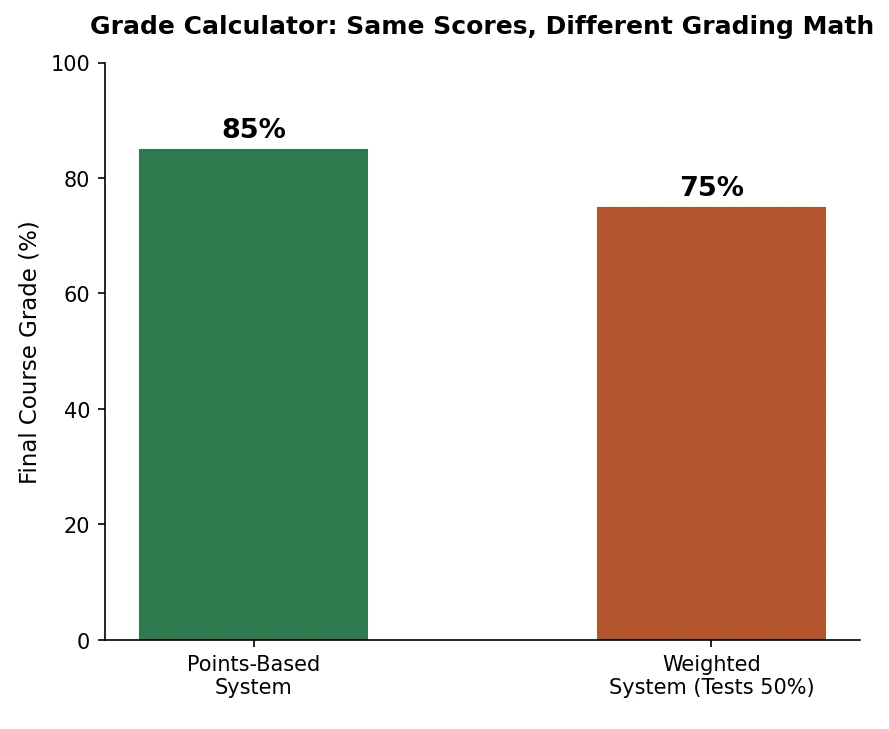
Same two scores, an entire letter grade apart. This is exactly why a grade calculator needs the correct weighting mode selected before its output can be trusted — you can score 100% on every homework assignment and still fail a class if the weighted final exam goes badly.
Semester Grade Calculation
Tracking one assignment is trivial. Tracking a semester-long grade calculation is a different challenge, because your standing shifts differently depending on when in the term you check it.
Early in the semester, a single bad quiz can swing your grade from an A to a C simply because there are so few graded items in the average yet. As the term progresses, that same single assignment moves the needle less and less — a pattern sometimes called grade inertia. By the final weeks, even a perfect score on a small assignment might shift your average by a fraction of a percent.
Same two scores, an entire letter grade apart. This is exactly why a grade calculator needs the correct weighting mode selected before its output can be trusted — you can score 100% on every homework assignment and still fail a class if the weighted final exam goes badly.
Current Grade vs. Cumulative Grade
- Current grade ignores anything not yet turned in. It answers: "based on what I've done so far, how am I doing?" — best for mid-semester check-ins.
- Cumulative grade treats every missing assignment as a zero. It answers: "if I stopped today, what would I get?" — best for end-of-semester reality checks.
| Time of Semester | Action | Purpose |
|---|---|---|
| Weeks 1–4 | Enter every category weight from the syllabus | Confirm your setup matches the actual grading rules |
| Midterms | Check your current grade | Decide whether extra help or a course adjustment is needed |
| Finals week | Use the target-grade feature | Calculate exactly what you need to pass or hit your goal |
Brief History of Different Grading Systems
Formal academic grading is younger than most people assume, and it started out far messier than today's standard letter scale. In 1785, Yale ranked students using Latin-derived tiers — "optimi" at the top, followed by lower categories down to the weakest performers. At William & Mary around the same era, students were sorted simply into "No. 1" and "No. 2," the latter reserved for those merely "orderly, correct, and attentive."
Harvard took a numerical approach, initially scoring students on a 1–200 scale (1–100 for math and philosophy specifically), before shifting after 1883 to a system of Roman-numeral "Classes" (I through V, with V meaning failure). Every one of these early systems was inconsistent from school to school, which is exactly the problem a standardized scale was eventually meant to solve.
The letter grade format familiar today traces back to Mount Holyoke College in 1887, which introduced an A-through-E scale (E for failing). That original scale was far stricter than modern norms — anything below 75% failed outright. The college later replaced E with F, and the letter-grade concept gradually spread to become the dominant model across American high schools and colleges, even though institutions still disagree today on details like whether to use plus/minus modifiers.
An Alternative to the Letter Grading System
Letter grades are efficient at summarizing performance on clearly right-or-wrong material, like a math exam. They're a much blunter tool for something inherently subjective, like a written essay, where a single letter can obscure more nuance than it captures.
A small number of schools skip letter grades entirely. Saint Ann's School in New York City, an arts-focused private school, instead has teachers write anecdotal narrative reports for each student — feedback aimed at growth rather than at chasing a specific letter.
The tradeoff is obvious: narrative feedback takes far more instructor time than a number does, which is part of why it remains rare at large universities with hundreds of students per course. For the foreseeable future, standardized letter and percentage grading — and the grade calculator tools built around it — will remain the default most students actually need to navigate.
GPA & Letter Grades in Colleges
In college, your percentage grade is a means to an end, not the final record. Your registrar converts that percentage into a "quality point" value — your GPA — and that converted number is what actually determines academic standing, scholarship eligibility, and graduation honors.
| Letter Grade | Percentage | Quality Points (4.0 scale) |
|---|---|---|
| A / A+ | 93–100% | 4.0 (some schools allow 4.3 for A+) |
| A- | 90–92% | 3.7 |
| B+ | 87–89% | 3.3 |
| B | 83–86% | 3.0 |
| B- | 80–82% | 2.7 |
| C+ | 77–79% | 2.3 |
| C | 73–76% | 2.0 |
| D | 60–69% | 1.0 |
| F | Below 60% | 0.0 |
Not every school follows the same rules. Harvard's Faculty of Arts and Sciences caps its scale at 4.0 and does not award an A+ at all. The University of California system uses a "weighted and capped" GPA that limits how many honors points a student can accumulate. Specialized programs add another layer: nursing programs frequently set the passing threshold at 74–75% rather than the more typical 60%.
Once your percentage grades for the term are final, our GPA Calculator converts them into your semester and cumulative GPA using your school's specific scale.
Grading Formulas
If you'd rather verify a grade calculator's output yourself, or you're building your own spreadsheet, here are the two core formulas behind nearly every result on this page.
1. Weighted Average Formula
Convert every weight to a decimal, multiply each score by its matching weight, then add the products together.
2. Target Grade Formula
If you're building this in a spreadsheet with current grade in A1, target grade in B1, and final weight in C1 (all as decimals), the formula translates directly to: