AP Statistics Score Calculator 2026
AP® Statistics Score Calculator
Predict your AP Statistics exam score instantly using current College Board scoring guidelines.
Format note: This calculator reflects the exam structure confirmed through the May 2026 administration (40 MCQ + 6 FRQ, composite out of 100). AP Statistics is being significantly redesigned starting with the 2026–27 school year — fully digital delivery, 42 MCQ, and only 4 FRQs worth 10 points each. See the full study guide for details.
Section I: Multiple Choice
No penalty for incorrect or blank answers — always answer every question.
Section II: Free Response
Estimate your raw points on each of the 6 FRQs (Q6 is the Investigative Task).
Score Breakdown
Predicted AP® Score
Estimated Grade
Enter your raw scores to see your prediction.
This AP Statistics score calculator uses estimated composite cutoffs based on historical AP scoring trends. College Board does not publish exact cutoffs until after scores release each July, and the actual curve varies year to year. Verify exam-day details on the official College Board AP Statistics page.
AP Statistics: The Complete 2026 Study Guide
Everything you need on AP Statistics in one place — exam format, unit-by-unit topics, scoring, score distribution, study strategy, and the major redesign coming in 2027.
What Is AP Statistics?
AP Statistics is College Board's introductory, college-level statistics course, built around four big ideas: exploring data, sampling and experimentation, probability and simulation, and statistical inference. It's algebra-based rather than calculus-based, which makes it accessible to a broad range of students, but the free-response section demands strong written communication — you're graded as much on how clearly you justify a statistical conclusion as on whether your final number is correct.
The course is widely useful across majors — business, psychology, biology, economics, and data science programs all lean on the reasoning skills it builds — which is part of why it remains one of the most widely taken AP exams nationally.
Exam Format (and the 2027 Redesign)
Through the May 2026 exam, AP Statistics is a hybrid digital exam: the multiple-choice section is completed in College Board's Bluebook app, while free-response answers are handwritten into a paper booklet that's collected for scoring.
| Section | Through May 2026 Exam | Starting 2026–27 School Year |
|---|---|---|
| Format | Hybrid digital (paper FRQ booklet) | Fully digital (no paper booklet) |
| Multiple Choice | 40 questions, 5 options each | 42 questions, 4 options each |
| Free Response | 6 questions, 4 pts each (24 total) | 4 questions, 10 pts each (40 total) |
| Timing | 90 min MCQ + 90 min FRQ | Not yet finalized by College Board |
| Weighting | 50% / 50% | 50% / 50% |
Unit-by-Unit Breakdown & Exam Weighting
Through the 2026 exam, the course framework has nine units. Units 1, 4, 6, and 7 carry the heaviest individual weight, so they deserve a disproportionate share of review time.
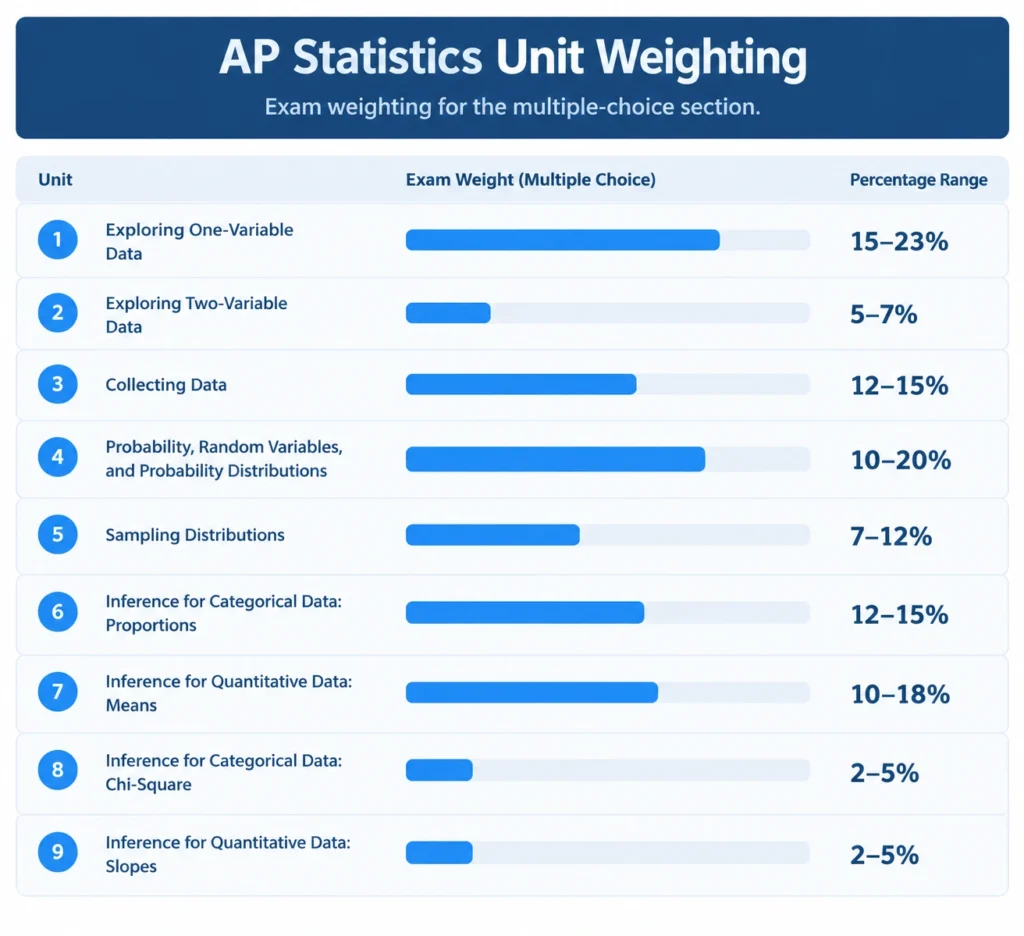
Unit 1 — Exploring One-Variable Data (15–23%)
Describing distributions with shape, center, and spread; boxplots, histograms, and dotplots; z-scores and the normal distribution.
Unit 2 — Exploring Two-Variable Data (5–7%)
Scatterplots, correlation, and least-squares regression, including interpreting residual plots and identifying influential points.
Unit 3 — Collecting Data (12–15%)
Sampling methods, bias, surveys, observational studies, and the design of controlled experiments — a favorite source of free-response questions on flawed study design.
Unit 4 — Probability, Random Variables, and Probability Distributions (10–20%)
Basic probability rules, conditional probability, discrete and continuous random variables, and the binomial and geometric distributions.
Unit 5 — Sampling Distributions (7–12%)
The sampling distribution of a sample proportion and sample mean, the Central Limit Theorem, and the conditions that justify using a normal approximation.
Unit 6 — Inference for Categorical Data: Proportions (12–15%)
Confidence intervals and significance tests for one and two proportions — one of the most heavily tested inference procedures on the exam.
Unit 7 — Inference for Quantitative Data: Means (10–18%)
Confidence intervals and t-tests for one and two means, plus paired data procedures.
Unit 8 — Inference for Categorical Data: Chi-Square (2–5%)
Chi-square tests for goodness of fit, homogeneity, and independence.
Unit 9 — Inference for Quantitative Data: Slopes (2–5%)
Confidence intervals and significance tests for the slope of a least-squares regression line.
FRQ Structure Explained
Through the May 2026 exam, Section II has six free-response questions, each worth 4 raw points:
- Questions 1–5 are shorter, targeted questions, each usually focused on one or two specific skills (data collection, probability, inference, etc.).
- Question 6, the Investigative Task, is the longest and most involved question. It applies familiar statistical concepts to an unfamiliar context and often asks you to extend a method you haven't explicitly practiced — it's graded holistically and rewards clear reasoning over a memorized procedure.
Starting with the redesigned exam, the FRQ section shrinks to four questions worth 10 points each: one assessing question formulation and data collection, one assessing data analysis and interpretation, and at least one assessing inference skills specifically.
How Your Composite Score Becomes a 1–5
Through the May 2026 exam, your multiple-choice raw score (out of 40) is scaled to 50 points, and your free-response raw score (out of 24) is scaled to 50 points. Those two scaled scores combine into a composite out of 100, which College Board then converts to the familiar 1–5 AP score using a curve finalized after the exam is administered. Because that curve shifts each year slightly, treat any calculator's output — including the one on this page — as a well-informed estimate rather than a guarantee:
| AP Score | Approx. Composite (out of 100) | Description |
|---|---|---|
| 5 | 63+ | Extremely well qualified |
| 4 | 52–62 | Well qualified |
| 3 | 41–51 | Qualified |
| 2 | 29–40 | Possibly qualified |
| 1 | 0–28 | No recommendation |
One common misconception worth clearing up: AP exams are not graded on a fixed percentage. In many years, students have earned a 3 with well under 70% of the total available points, because College Board sets cutoffs based on how the exam performed overall, not a flat pass line.
Want to see your predicted score right now?
Plug in your practice-test raw points using the interactive calculator.
Score Distribution & Pass Rate
AP Statistics has historically had one of the lower pass rates among AP exams — recent years put the 3-or-higher rate at roughly 60–62%, below the typical all-AP-subject average of around 70%. That doesn't mean the exam is unusually punishing; it reflects both a broad, non-self-selecting student population (many students take it as their only AP math-adjacent course) and a free-response section that rewards precise statistical writing over calculation alone.
How to Study for Each Unit
A 3 is the College Board's official "qualified" threshold and can earn credit at many colleges. A 4 or 5 is preferred by more selective schools and by STEM-heavy programs that use AP Statistics for placement into higher-level courses. Given the exam's comparatively lower 5-rate, even a 4 is a strong, competitive result for most college applications.
- Prioritize Units 1, 4, 6, and 7. Together these make up close to half the multiple-choice section, so mastering distributions, probability, and inference for proportions and means produces the biggest score gains per hour studied.
- Memorize the inference procedure checklist. Name the test, state hypotheses, check conditions, calculate the test statistic and p-value, then conclude in context — missing any one step costs points even with a correct final answer.
- Practice writing in context. The free-response section penalizes vague language ("it's significant") in favor of specific, contextual statements ("there is convincing evidence that the true proportion of...").
- Don't skip the Investigative Task. It's worth as much as any other FRQ and tests your ability to extend familiar methods — practicing with unfamiliar scenarios builds the flexibility it requires.
- Read every graph carefully. Residual plots, normal probability plots, and scatterplots appear on nearly every exam, and misreading one is one of the most common avoidable point losses.
AP Statistics vs. AP Calculus
Students frequently compare the two since both are common junior/senior-year math options. AP Statistics is algebra-based and focused on data interpretation, experimental design, and inference — there's no calculus involved. AP Calculus (AB or BC) is proof- and computation-heavy, focused on limits, derivatives, and integrals. Neither is strictly "easier" — Statistics has a lower overall pass rate, but many students who struggle with calculus-heavy math find its conceptual, writing-based approach more approachable. The right choice depends more on intended major than on general difficulty: engineering and physical-science-bound students typically need Calculus, while business, social-science, and biology-bound students often get more direct value from Statistics.
College Credit & Placement
Credit policies vary significantly by institution. Many colleges award credit for a 3 or higher, since AP Statistics maps directly onto a widely required introductory statistics course across majors including business, psychology, and the social sciences. More selective schools, or departments with their own statistics sequence, may require a 4 or 5, or may grant placement without credit. Always check the specific credit policy published by each college you're applying to.
Frequently Asked Questions
Mathaversity's More Tools
Retirement Calculator
Plan your financial future and estimate your retirement savings easily.
Open CalculatorFinal Grade Calculator
Calculate the grade you need on your final exam to reach your target course grade.
Open Calculator